
I came across a beautiful map of a fairly large area of the northeastern Atlantic Ocean yesterday and wanted to share it for this week's Sea-Floor Sunday.
I have a few snapshots of the map in this post, but to really appreciate the map you should go to this site and download the high-resolution version (~9 MB). That page is part of the website for IFREMER, or the French Research Institute for Exploration of the Sea.
 The map at left is for context and shows the area of interest. We will be looking at the area from offshore of France, the Iberian Peninsula, and parts of northernmost Africa to the Mid-Atlantic Ridge.
The map below is a snapshot of the entire map area. As noted above, scroll to the bottom of this site to download the 9 MB jpeg. I especially like their use of oranges and reds for the shallowest depths in the bathymetry scale.
Note the cluster of seamounts just west of the Strait of Gibraltar. These are a northern extension of the Canary Islands volcanic chain (that are just off the map to the south). The origin of the volcanic chain is debated (hotspot/plume volcanism, zone of extensional deformation, etc.). This paper (1), which favors a hotspot interpretation, focuses on the Canary Islands themselves but also discusses the implications for the chain.

The other noticeable cluster of red colors just east and off-axis of the Mid-Atlantic Ridge in the map above are the Azores. This triangular volcanic plateau connects the Mid-Atlantic Ridge with the East Azores Fracture Zone, which runs west-to-east ultimately separating Africa and Iberia. In other words, it's a triple junction. There are numerous papers out there about the Azores; here are just a couple I found while researching this post (2 and 3). The image below (from 3) shows the seismicity along this plate boundary. Click on it for a slightly larger image.

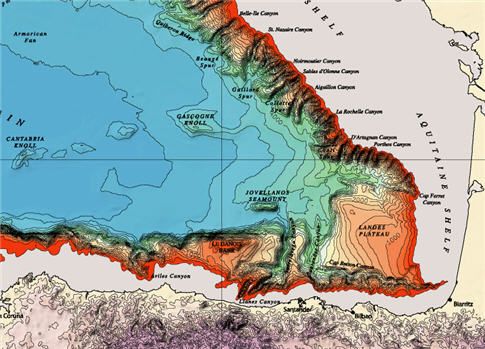
The series of images below are zoomed-in snapshots of the map. Note the broad continental shelf offshore of France in contrast to the much narrower shelf north of the Pyrenees
The image below is zoomed in to the northern part of the Azores triple junction.

The final image below shows the Strait of Gibraltar. Oooh...looks like a nice submarine fan building out into the Atlantic right out of the strait.

See all Sea-Floor Sunday posts here.
References
(1) Geological Magazine (1998), 135: 591-604 Cambridge University Press doi:10.1017/S0016756898001447
(2) 1998, Lourenco et al., Morpho-tectonic analysis of the Azores Volcanic Plateau from a new bathymetric compilation of the area: Marine Geophysical Researches. 10.1023/A:1004505401547
(3) Kiratzi and Papazachos, 1995, Active crustal deformation from the Azores triple junction to the Middle East: Tectonophysics Volume 243, Issues 1-2, 15, Pages 1-24 10.1016/0040-1951(94)00188-F
~~~~~~~~~~~~~~~~~~~~~~~~~~~~~~~~~~~~~~~~~~~~~~~~~~~~~~~~~~~~~~~


